Introduction
Patients with respiratory diseases can pose a risk of droplet
infection to medical staff and fellow patients. Adhering to guidelines
such as those set forth by the World Health Organization [1] and
the regulations in numerous countries is essential, mandating the
wearing of masks covering the mouth and nose in public areas
and enclosed spaces, thereby mitigating the risk of transmission.
Patients grappling with respiratory conditions and those in the
recovery phase from anesthesia may necessitate supplementary
oxygen delivered through a Hudson mask affixed to the face.
The challenge is determining the optimal sequence for patients
requiring both additional oxygen through an enrichment mask
and protection with a mask covering the mouth and nose. Should
the protective mask be placed first, maximizing coverage and
infection protection, with the enrichment mask layered on top?
Alternatively, is it more effective to apply the enrichment mask
directly to the patient’s face for optimal oxygen enrichment, with
the protective mask worn over it? Currently, there is a notable
absence of information in the medical literature pertaining to
the impact of a protective mask on the concentrations of inhaled
and exhaled oxygen and carbon dioxide during breathing when
using an enrichment mask, both with and without the additional
layer of a protective mask. Access to accurate information
holds the potential to enable informed utilization of protective
masks, ensuring optimal protection for healthcare staff while
simultaneously delivering optimal care for patients.
Objectives
This study aims to compare the concentrations of inhaled and
exhaled oxygen and carbon dioxide in five different scenarios
involving the use of an enrichment mask and a protective mask.
• Oxygen mask only
• Protective mask only
• A protective mask placed over an oxygen mask
• An oxygen mask placed over a protective mask
• An oxygen mask mounted on an N95 protective mask
Materials and methods
The study was conducted in the Anesthesia Department at the
English Hospital in Nazareth under the supervision of a specialist
anesthesiologist.
Following approval from the Institutional Ethics Committee
and after providing a comprehensive explanation and obtaining
signed informed consent forms, 30 healthy volunteers were
directed to lie supine on a horizontal mattress and breathe normally. Throughout the study, the following configurations
were applied to the subjects’ faces for a duration of 5 minutes.
Room air PM- Protective mask (DISPOSABLE MEDICAL MASKTcare3ply-VOLA PRODUCTS, production: PRC) in breathing room
air
OM - The enrichment mask (HI OXYGEN MASK WITH 2M TUBE
- WKM-1110, manufacturer: Weikang, China) is fitted to the face
while enriching oxygen at a rate of 6 liters per minute.
OM under PM- The enrichment mask is fitted to the face,
delivering oxygen at a rate of 6 liters per minute, and on top of it,
a standard protective mask is placed.
OM over PM- The enrichment mask is fitted to the face,
delivering oxygen at a rate of 6 liters per minute, and underneath
it is a standard protective mask.
OM over N95- An enrichment mask is fitted to the face,
delivering oxygen at a rate of 6 liters per minute, and underneath
it is a protective mask of the N95 type (GB2626-2006-AA,
Manufacturer: Xiantao Xianghua Industry & Trade Co., LTD.).
Conducting the measurements
Gas concentration measurements in the inhaled and exhaled
air were conducted using continuous monitoring on a BENEVISION
N17 MINDRAY type monitor. The gas analysis module of the
monitor was connected to an oxygen nasal cannula specifically
designed for measurement (NASAL OXYGEN CANNULA-KYOT-1152, manufacturer: MADEWELL, China).
The measurements were conducted continuously, with
60-second intervals between each stage to allow for adjustments
in the experimental configuration.
Inclusion criteria
• Ages 18-65
• BMI 18-25
• Height between 160 and 185 cm
• ASA I-II
Exclusion criteria
• History of heart disease.
• History of lung disease.
• Underwent surgery within the last week.
• Facial deformities.
Medical care
The study did not involve medical treatment or diagnosis. The
total exposure to high-concentration oxygen for each subject did
not exceed 20 minutes, and the concentration remained below 60%.
All participants reported feeling well after completing the study.
Statistical analysis
The statistical analysis included the examination of demographic
data using mean and standard deviation. Independence was
assessed through a one-way analysis of variance (ANOVA) test,
followed by a post hoc LSD follow-up test. A significance level of
less than 0.05 was defined as statistically significant.
Results
In the study, 24 men and 6 women participated. The
demographic data of the study participants are presented in Table
1 below.
The concentrations of inhaled gases in various configurations
are presented in Table 2.
Table 1: Data of the study participants.
|
|
n |
% |
| M / F |
Female |
6 |
20.00% |
| Male |
24 |
80.00% |
|
| ASA |
I |
26 |
86.70% |
| II |
4 |
13.30% |
|
|
range |
Mean |
±SD |
| Age (years) |
20-60 |
32.97 |
9.47 |
| Height (cm) |
160-185 |
174.13 |
7.14 |
| Weight (Kg) |
50-84 |
69.83 |
9.06 |
| BMI (Kg/m2) |
18.6-24.9 |
22.79 |
1.74 |
Table 2: Oxygen and carbon dioxide concentrations during inhalation in various configurations.
|
Room air+PM |
OM |
OM under PM |
OM over PM |
OM over N95 |
p.value |
| Mean |
SD |
Mean |
SD |
Mean |
SD |
Mean |
SD |
Mean |
SD |
|
| O2 |
20.06a |
0.36 |
48.52b |
11.2 |
52.31b |
14.72 |
39.78c |
8.52 |
32.94d |
5.78 |
<0.001 |
| CO2 |
5.05a |
2.07 |
4.05b |
2.03 |
4.16b |
1.58 |
4.39b |
1.49 |
4.23b |
1.54 |
0.202 |
Table 3: Clinicopathological characteristics of PEACs in comparison with MCC.
|
Room air+PM |
OM |
OM under PM |
OM over PM |
OM over N95 |
p.value |
| Mean |
SD |
Mean |
SD |
Mean |
SD |
Mean |
SD |
Mean |
SD |
|
| O2 |
14.85a |
0.7 |
49.09b |
6.98 |
54.77c |
7.82 |
41.83d |
6.13 |
30.41e |
6.74 |
<0.001 |
| CO2 |
40.17a |
3.57 |
39.05a |
3.87 |
38.81a |
3.64 |
39.19a |
3.99 |
39.22a |
3.77 |
<0.00 |
Table 4: Mean and standard deviation of oxygen and carbon di-
oxide concentration (in inhalation and exhalation conditions) - com-
parison of oxygen mask versus protective mask using the t-test for
dependent samples.
|
Protective Mask
|
Oxygen Mask |
|
|
|
Mean |
SD |
Mean |
SD |
t(df=29) |
p.value |
| Inspired_O2 |
20.06 |
0.36 |
48.52 |
11.2 |
-14.04 |
0 |
| Inspired_CO2 |
5.05 |
2.07 |
4.05 |
2.03 |
3.17 |
0.004 |
| Expired_O2 |
14.85 |
0.7 |
49.09 |
6.98 |
-25.93 |
0 |
| Expired_CO2 |
40.17 |
3.57 |
39.05 |
3.87 |
4.75 |
0 |
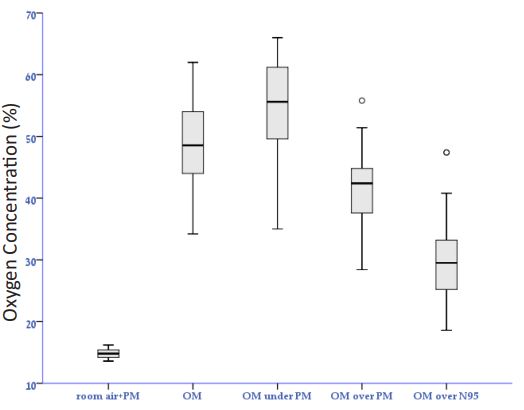
Concentration of inhaled oxygen
In a one-way analysis of variance test, a significant difference
was identified in the average oxygen concentrations across the five
conditions (F(4,145)=55.49, p<.001, η²=0.605). This indicates that
60.5% of the variation in concentration averages can be attributed
to the different situations and types of masks. The maximum
observed concentration was in the state (OM under PM), with
an oxygen mask on top of a standard protective mask (M=52.31,
SD=14.72), while the minimum concentration was noted in the
state (room air+PM) with a protective mask (M=20.06, SD=0.36)
(refer to graph 1).
Table 5: Mean and standard deviation of oxygen and carbon di-
oxide concentration (in inhalation and exhalation conditions) - com-
parison of an oxygen mask versus an oxygen mask with a standard
protective mask on top using a t-test for dependent samples.
|
Oxygen Mask Alone vs. Oxygen
Mask with a Standard
Protective Mask on Top
|
Oxygen Mask |
|
|
|
Mean |
SD |
Mean |
SD |
t(df=29) |
p.value |
| Inspired_O2 |
52.31 |
14.72 |
48.52 |
11.2 |
-2.372 |
0.025 |
| Inspired_CO2 |
4.16 |
1.58 |
4.05 |
2.03 |
-0.369 |
0.715 |
| Expired_O2 |
54.77 |
7.82 |
49.09 |
6.98 |
-6.369 |
0 |
| Expired_CO2 |
38.81 |
3.64 |
39.05 |
3.87 |
1.278 |
0.211 |
Table 6: Mean and standard deviation of oxygen and carbon di-
oxide concentration (in inhalation and exhalation conditions) - com-
parison of an oxygen mask versus an oxygen mask with a standard
protective mask underneath using a t-test for dependent samples.
|
Oxygen Mask with a Standard
Protective Mask Underneath
|
Oxygen Mask |
|
|
|
Mean |
SD |
Mean |
SD |
t(df=29) |
p.value |
| Inspired_O2 |
39.78 |
8.52 |
48.52 |
11.2 |
3.637 |
0.001 |
| Inspired_CO2 |
4.39 |
1.49 |
4.05 |
2.03 |
-1.161 |
0.255 |
| Expired_O2 |
41.83 |
6.13 |
49.09 |
6.98 |
6.712 |
0 |
| Expired_CO2 |
39.19 |
3.99 |
39.05 |
3.87 |
-0.438 |
0.665 |
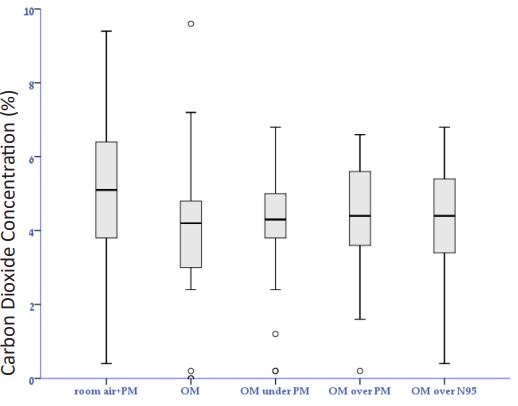
Concentration of inhaled carbon dioxide
In a one-way analysis of variance test, it was determined that
there is no significant difference in the average carbon dioxide
concentration across the five conditions (F(4,145)=1.511, p>.05,
η²=0.04). Consequently, only 4% of the variation in concentration
averages can be attributed to the different situations and types of
masks. The maximum observed concentration was in the (room
air+PM) protective mask condition (M=5.05, SD=2.07), while the
minimum concentration was recorded in the (OM) oxygen mask
condition (M=4.05, SD=2.03), with minimal differences between
the various situations. Additionally, an LSD post hoc follow-up
test indicated a statistical difference between the protective mask
condition and all other conditions, with no statistical difference
observed among the remaining situations and types of masks (see
graph 2).
Concentration of inhaled gases
The concentration of inhaled gases in various configurations is
presented in Table 3.
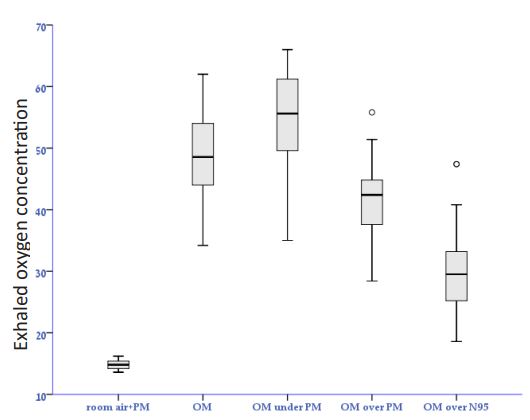
Concentration of exhaled oxygen
In a one-way analysis of variance test, a significant difference
was identified in the average oxygen concentrations across the five conditions (F(4,145)=196.12, p<.001, η²=0.844). This implies
that 88.4% of the variation in concentration averages can be
attributed to the different situations and types of masks. The
maximum observed concentration was in the state (OM under
PM), with an oxygen mask on top of a standard protective mask
(M=54.77, SD=7.82), while the minimum concentration was noted
in the state (room air+PM) with a protective mask (M=14.85,
SD=0.70). Furthermore, the LSD post hoc follow-up test indicated
a statistical difference between all the situations and types of
masks (See 3).
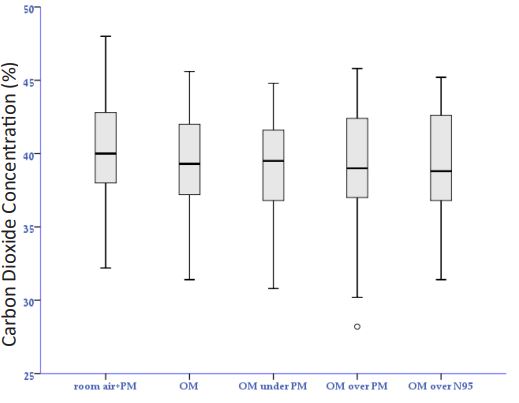
Concentration of exhaled carbon dioxide
In a one-way analysis of variance test, it was determined
that there is no significant difference in the average carbon
dioxide concentration across the five conditions (F(4,145)=0.575,
p>.05, η²=0.016). Consequently, only 1.6% of the variation in
concentration averages can be attributed to the different situations
and types of masks. The exhalation value remains nearly constant,
with an average value around (M=40.0), and there is no statistical
difference observed across all situations and types of masks. See
graph 4 (below).
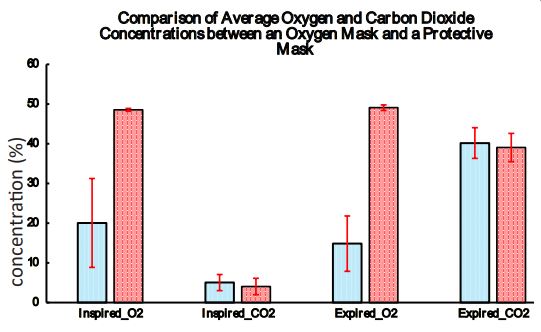
Comparing the data in relation to the oxygen mask condition
oxygen mask versus protective mask
The comparison between the two conditions was conducted
using a t-test for dependent samples. The results of these
comparisons are displayed in Table 4 (below).
Based on the findings presented in the table above, it is evident
that there is a statistically significant difference in all parameters
(both exhalation and inhalation) for both oxygen and carbon
dioxide between the conditions of using an oxygen mask and a
protective mask.
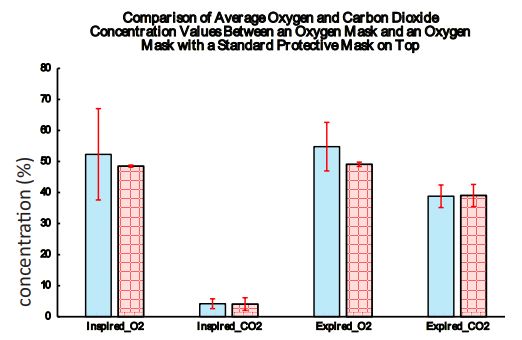
Oxygen mask alone vs. oxygen mask with a standard
protective mask on top
The comparison between the two conditions was conducted
using a t-test for dependent samples. The results of these
comparisons are presented in Table 5 (below).
Table 7: Mean and standard deviation of oxygen and carbon diox-
ide concentration (in inhalation and exhalation conditions) – compar-
ison of an oxygen mask versus an oxygen mask and an N95 protective
mask underneath using a t-test for dependent samples.
|
oxygen mask and an N95
protective mask underneath
|
Oxygen Mask |
|
|
|
Mean |
SD |
Mean |
SD |
t(df=29) |
p.value |
| Inspired_O2 |
32.94 |
5.78 |
48.52 |
11.2 |
6.513 |
0 |
| Inspired_CO2 |
4.23 |
1.54 |
4.05 |
2.03 |
-0.753 |
0.457 |
| Expired_O2 |
30.41 |
6.74 |
49.09 |
6.98 |
15.373 |
0 |
| Expired_CO2 |
39.22 |
3.77 |
39.05 |
3.87 |
-0.739 |
0.466 |
Table 8: Mean and standard deviation of oxygen and carbon diox-
ide concentration (in inhalation and exhalation conditions) - compar-
ison of an oxygen mask with a standard protective mask underneath
vs. an oxygen mask with a standard protective mask on top using a
t-test for dependent samples.
|
oxygen mask and an N95
protective mask underneath
|
Oxygen Mask with a Standard
Protective Mask Underneath
|
|
|
|
Mean |
SD |
Mean |
SD |
t(df=29) |
p.value |
| Inspired_O2 |
52.31 |
14.72 |
39.78 |
8.52 |
4.04 |
<.001 |
| Inspired_CO2 |
4.16 |
1.58 |
4.39 |
1.49 |
-0.59 |
0.559 |
| Expired_O2 |
54.77 |
7.82 |
41.83 |
6.13 |
7.13 |
<.001 |
| Expired_CO2 |
38.81 |
3.64 |
39.19 |
3.99 |
-0.386 |
701 |
According to the findings presented in the table above, a statistically significant difference was observed in the concentration
of oxygen during inhalation (t=-2.372, p=0.025). The concentration was higher with an oxygen mask and a standard protective
mask (M=52.31, SD=14.72) compared to an oxygen mask alone
(M=48.52, SD=11.20). No significant differences were found in
the levels of carbon dioxide during both inhalation and exhalation across all parameters. However, a statistically significant
difference was identified in the oxygen concentration during exhalation (t=-6.369, p<0.01), with higher oxygen concentration
observed when using an oxygen mask with a standard protective
mask on top (M=54.77, SD=7.82) compared to an oxygen mask
alone (M=49.09, SD= 6.98). The findings are visually represented
in the graph below.
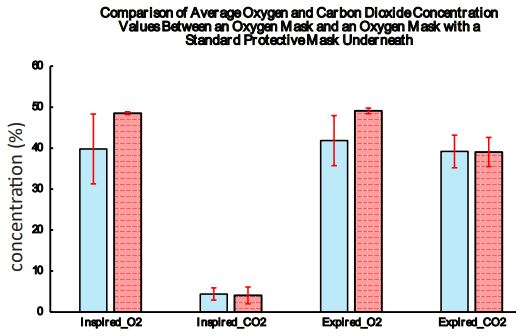
Comparison: Oxygen mask alone vs. oxygen mask with a standard protective mask underneath
The comparison between the two conditions was conducted
using a t-test for dependent samples. The results of these comparisons are presented in Table 6 (below).
According to the findings presented in the table above, a statistically significant difference was observed in the concentration
of oxygen during inhalation (t=3.637, p=0.001). The concentration
was higher with an oxygen mask (M=48.52, SD=11.202) compared
to an oxygen mask with a standard protective mask underneath
(M=39.78, SD=8.52). No significant differences were found in the
levels of carbon dioxide during both inhalation and exhalation
across all parameters. However, a statistically significant difference was identified in the oxygen concentration during exhalation
(t=6.712, p<0.01), with higher oxygen concentration observed
when using an oxygen mask (M=49.09, SD=6.98) compared to
an oxygen mask with a standard protective mask underneath
(M=41.83, SD=6.13). The findings are visually represented in the
graph below.
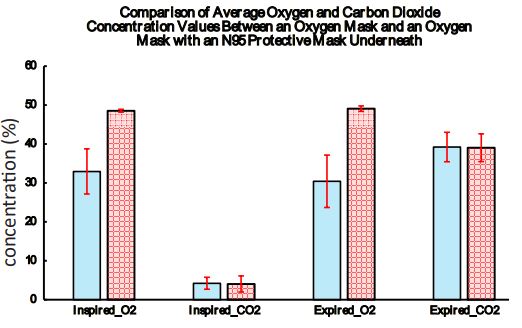
Oxygen mask alone vs. oxygen mask with an n95 protective
mask underneath
The comparison between the two conditions was conducted
using a t-test for dependent samples. The results of these comparisons are presented in Table 7 (below).
According to the findings presented in the table above, a statistically significant difference was observed in the concentration
of oxygen during inhalation (t=6.513, p<0.001). The concentration
was higher with an oxygen mask (M=48.52, SD=11.202) compared
to an oxygen mask with an N95 protective mask underneath
(M=32.94, SD=5.78). No significant differences were found in the
levels of carbon dioxide during both inhalation and exhalation
across all parameters. However, a statistically significant difference was identified in the oxygen concentration during exhalation
(t=15.373, p<0.001), with higher oxygen concentration observed
when using an oxygen mask (M=49.09, SD=6.98) compared to an
oxygen mask with an N95 protective mask underneath (M=30.41,
SD=6.74). The findings are visually represented in the graph below.
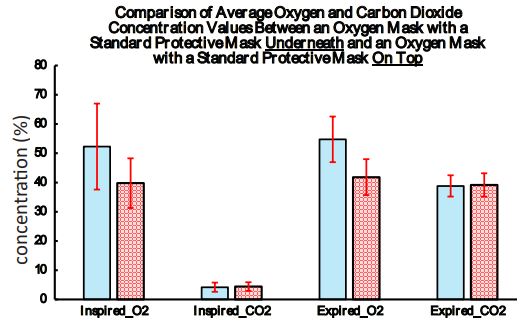
Oxygen mask with a standard protective mask underneath vs.
Oxygen mask with a standard protective mask on top
The comparison between the two conditions was conducted
using a t-test for dependent samples. The results of these comparisons are presented in Table 8 (below).
According to the findings presented in the table above, a statistically significant difference was observed in the concentration
of oxygen during inhalation (t=4.04, p<0.001). The concentration
was higher with an oxygen mask and a normal protective mask
on top (M=52.31, SD=14.72) compared to an oxygen mask with
a standard protective mask underneath (M=39.78, SD=8.52). No
significant differences were found in the levels of carbon dioxide during both inhalation and exhalation across all parameters.
However, a statistically significant difference was identified in the
oxygen concentration during exhalation (t=7.13, p<0.001), with
higher oxygen concentration observed when using an oxygen
mask with a standard protective mask on top (M=54.77, SD=7.82)
compared to an oxygen mask with a standard protective mask
underneath (M=41.83, SD=6.13). The findings are visually represented in the graph below.
Conclusion
The method of wearing protective masks and oxygen masks, as
well as the type of protective mask, significantly affects the concentration of inhaled oxygen during oxygen enrichment administration.
When administering oxygen at a rate of 6 liters per minute, the
highest percentage of inhaled oxygen (52%) is achieved by placing the oxygen mask directly on the patient’s face, with a normal
protective mask on top. This concentration surpasses the oxygen concentration obtained using only an oxygen mask (49%) (t=4.04,
p<0.001).
Wearing a standard protective mask under the oxygen mask
reduces the percentage of inhaled oxygen to 40%, while wearing
an N95 mask under the oxygen mask further decreases the percentage of inhaled oxygen to 33%.
No significant difference was observed in the concentration of
inhaled or exhaled carbon dioxide among the different configurations. Treatment protocols for patients requiring oxygen enrichment and protection against droplet infection should consider
these effects to ensure adequate oxygen enrichment.
References
- WHO. Coronavirus disease (COVID-19) advice for the public: When
and how to use masks. Available from: https://www.who.int/
emergencies/diseases/novel-coronavirus-2019/advice-for-public/
when-and-how-to-use-masks?adgroupsurvey={adgroupsurvey}&
gclid=Cj0KCQiAy4eNBhCaARIsAFDVtI10VYI74YFFKquacVkBiLOtwzl
mVBTd-pCNYJ9UERdOmXEQ4q97tnwaAs8sEALw_wcB.
- Protective Face Masks: Effect on the Oxygenation and Heart Rate
Status of Oral Surgeons during Surgery Antonio Scarano, Francesco
Inchingolo, Biagio Rapone, Felice Festa, Sergio Rexhep Tari and
Felice Lorusso.